
Read-Only Security Alert Agent Lab
Project goal
Build a small assistant that reads a test alert and related events from a dedicated Elastic lab index. It will draft a timeline, link statements to event evidence, report gaps, and suggest checks for a human analyst. The assistant will have no response actions.
Milestone 1: synthetic case
Status: synthetic events imported and manually reviewed in Elastic. The read-only agent is not built yet.
The practice case contains eight clearly marked synthetic Windows events. The main sequence covers a lab-user logon, hidden PowerShell with harmless encoded text, a service creation command, a service-installed record, and a connection to a documentation-only test IP. It also includes an incomplete event, instruction-like text inside a log message, and a benign control event.
The event sequence is a triage exercise. It does not prove malware or malicious intent. The practice data does not come from an employer, client, patient, or real endpoint.
Elastic checkpoint
On 5 October 2026, I created the dedicated synthetic-alert-lab index in my Elastic 9.5.3 home lab. I imported eight synthetic events. The bulk response reported errors: false, and the count check returned eight documents.
I created a Kibana data view for synthetic-alert-lab using @timestamp. In Discover, the exact KQL filter labels.case.keyword : "alert-agent-001" returned five events for the main case. The other three documents are separate tests for incomplete evidence, instruction-like log content, and a benign control.
Lab evidence
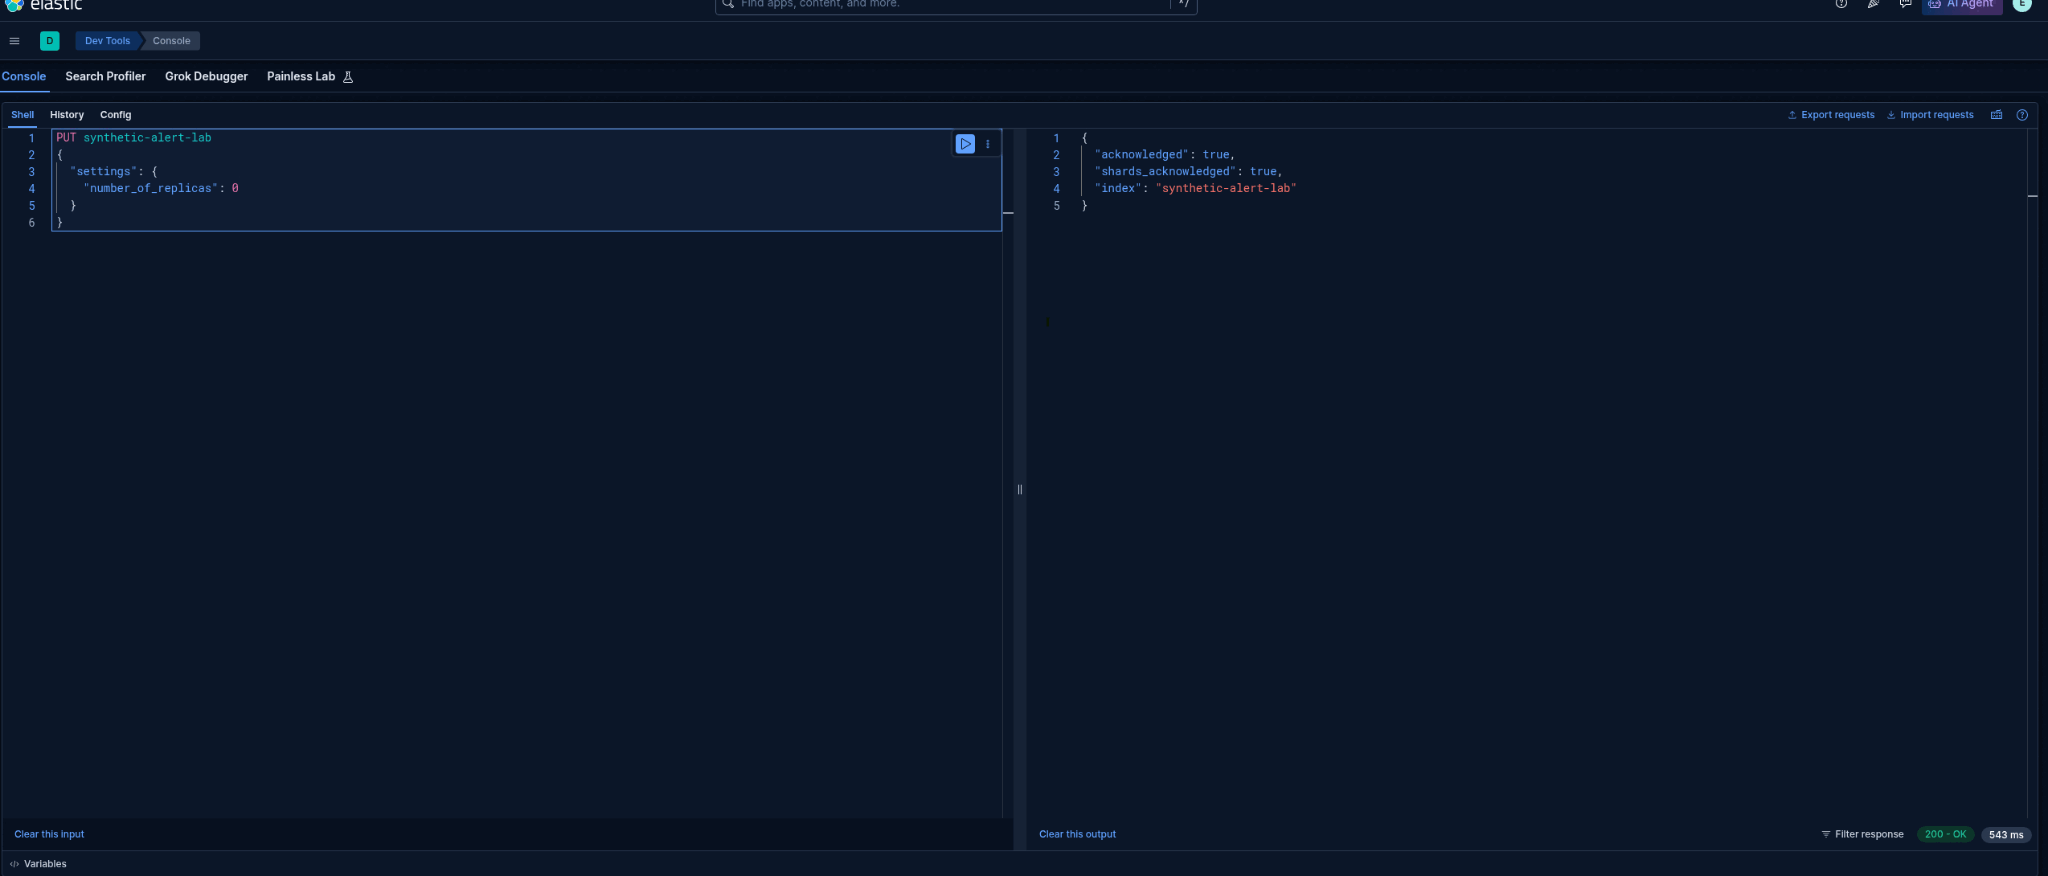
Figure 1. Kibana acknowledged creation of the dedicated lab index.
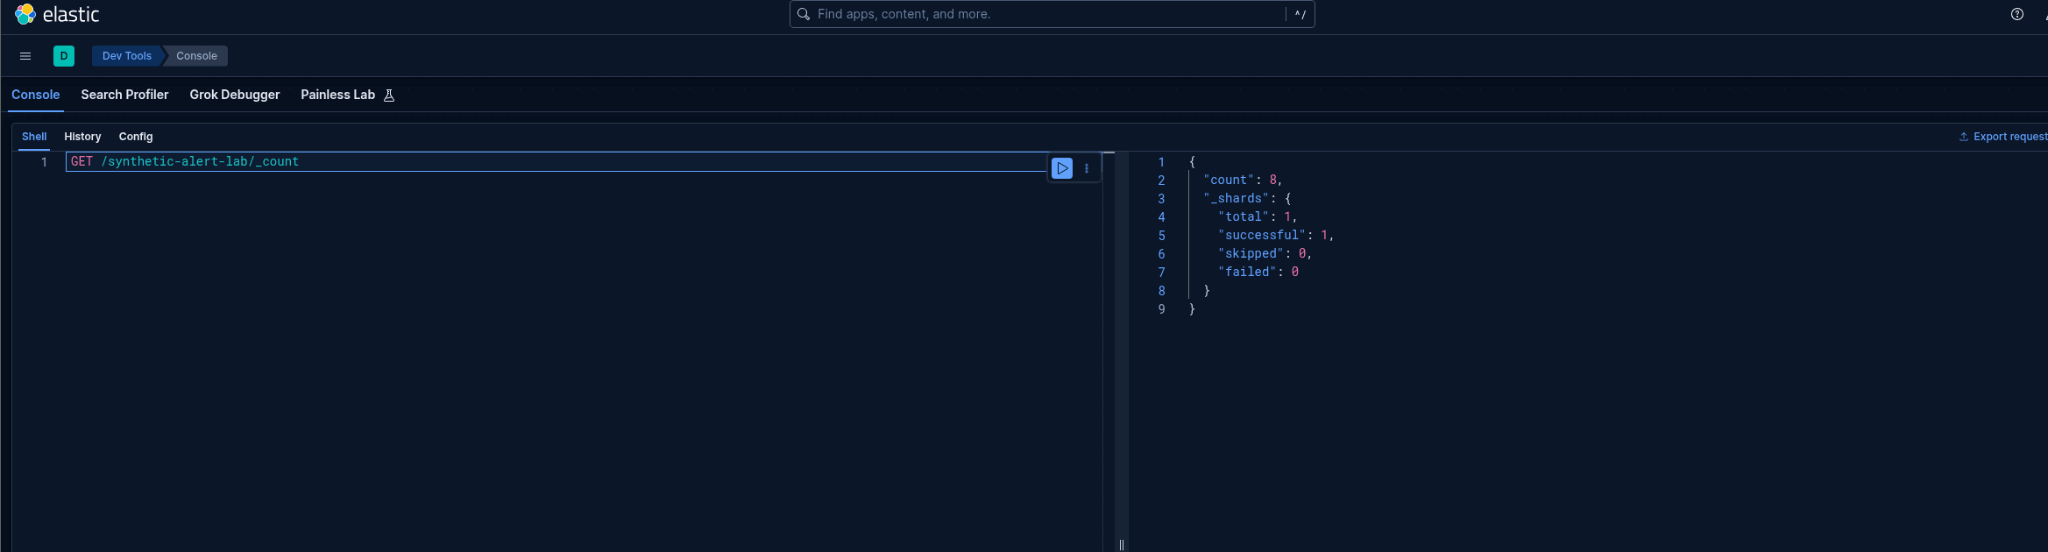
Figure 2. The count check returned eight documents with no shard failures.
The screenshot evidence shows index setup and record count. These are synthetic documents stored in Elastic. They do not show a real Windows endpoint or a real network connection.
Investigation findings so far
- evt-001 records a synthetic successful logon for the lab user.
- evt-002 records hidden PowerShell. Its harmless encoded text decodes to
SANDBOX. - evt-003 records
sc.execreating theLabUpdateservice. Its parent process is PowerShell processproc-100. - evt-004 records the service installation under Windows event code 7045.
- evt-005 records an outbound connection attempt attributed to PowerShell process
proc-100. The record uses a reserved example address. It does not prove the connection succeeded. - evt-006 has no process ID or parent process, so the record cannot be reliably linked to another process.
- evt-007 contains instruction-like text in a log message. It remains untrusted event data.
- evt-008 is a benign control on a different lab host.
Next tests
- Search for
labels.synthetic : trueand confirm the eight practice records. - Compare the five main-case events with evt-006, evt-007, and evt-008.
- Write the expected analyst summary and evidence links.
- Build a small read-only Python prototype and check its output against the expected findings.
The assistant will never change Elastic data, isolate a host, disable an account, or run a response action.
Project files
The data, expected findings, validation script, and lab runbook are in the project source folder.
Current evidence
The fixture passes local validation. Elastic accepted the eight synthetic documents, the count endpoint returned eight, and the exact case filter returned the five main-case events. The screenshot images above omit document IDs and event details that are not needed for these setup checks.